 Metena
Bollinger Bands: definition and bitcoin example
An envelope drawn around a moving average, two standard deviations wide. It shows whether the price is unusually high or low given its recent volatility.
Definition
Bollinger Bands are built from a 20-day moving average. The upper band sits two standard deviations above it, the lower band two standard deviations below.
Their width follows volatility. Very tight bands signal a calm market, which often comes before a wider move, without telling its direction. A price touching the upper band is unusually high compared with the last 20 days, which does not mean it will fall.
How to read the chart
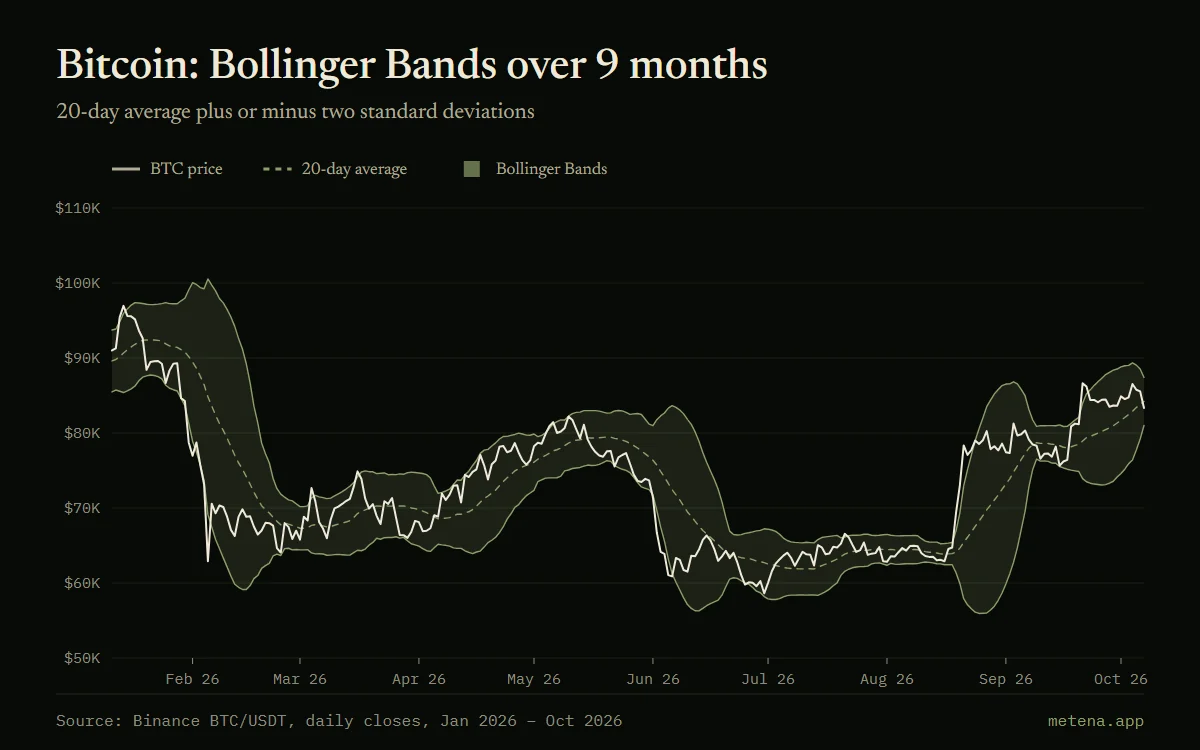
The green area lies between the two bands, the dotted line is the 20-day average, the bright line the bitcoin price.
Look for the moments when the area narrows, then at what follows.
Worked example
From 11 January to 7 October 2026, bitcoin closed above the upper band on 14 days and below the lower band on 12 days. The bands were widest on 12 February 2026 (45% of the price) and tightest on 15 August 2026 (4%).
In Metena
In a Metena strategy, a Bollinger Band condition can be written as an expression, for example “price below the 20-day average minus two standard deviations”, then tested in the backtest.
Notify me at launchRelated terms
- Volatility
- The size of an asset’s price swings. High volatility means large moves, up as well as down.
- Moving average (SMA, EMA)
- The average price over a given period: it smooths out noise and brings out the trend. The EMA gives more weight to recent prices.
- ATR (Average True Range)
- The average size of price moves over a period. It is used to gauge volatility and to set consistent risk levels.
- RSI
- A momentum indicator between 0 and 100. Above 70 it is often called overbought; below 30, oversold. It is a reference point, never a buy signal on its own.



Put these ideas into practice.
Write your strategy in a few minutes: Metena analyses it when you ask and explains each term in context.
Notify me at launchEducational content. It is not investment advice. Crypto-assets carry a high risk that can go as far as the total loss of capital.