 Metena
Crypto volatility: definition and history
The size of an asset’s price swings. High volatility means large moves, up as well as down.
Definition
Realised volatility is calculated from past daily moves: their standard deviation, scaled to a year. An annual volatility of 60% means a 60% move over a year, up or down, is nothing unusual.
It changes a lot over time. Calm periods are often followed by sharp moves, and crashes send volatility soaring within days.
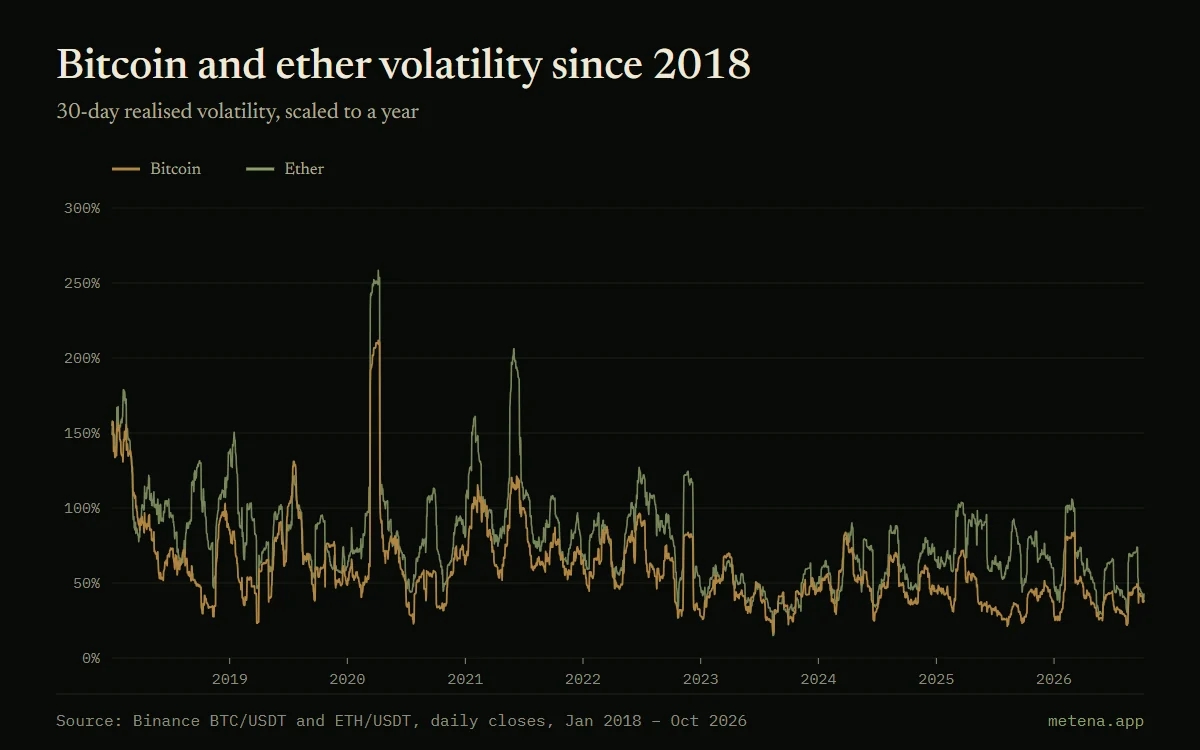
How to read the chart
Each point is the volatility of the last 30 days, scaled to a year: gold for BTC, green for ETH.
The peaks match crashes and manias; the troughs, months when the price barely moved.
Worked example
Since 2018, bitcoin’s 30-day volatility has averaged 60% a year, against 79% for ether. It peaked at 212% on 6 April 2020, after the March crash, and fell to 17% on 13 August 2023. On 7 October 2026, it stands at 38% for BTC and 43% for ETH.
In Metena
A condition in your Metena strategy can use 30-day realised volatility, for example to reduce purchases when it passes a threshold.
Notify me at launchRelated terms
- Sharpe ratio
- Return relative to the volatility endured. The higher it is, the more the return was earned with moderate turbulence.
- ATR (Average True Range)
- The average size of price moves over a period. It is used to gauge volatility and to set consistent risk levels.
- Bollinger Bands
- An envelope drawn around a moving average, two standard deviations wide. It shows whether the price is unusually high or low given its recent volatility.
- Maximum drawdown
- The largest fall, as a percentage, from a peak to the low that follows. It measures what you must be able to withstand without abandoning your strategy.
- Correlation
- A measure, between −1 and 1, of how far two assets tend to move in the same direction.


Related guides
- Crypto risk management: position sizing, leverage and liquidation
- How much to put in each position, what leverage really changes and why diversifying across cryptocurrencies protects little: real bitcoin and ether examples.


Put these ideas into practice.
Write your strategy in a few minutes: Metena analyses it when you ask and explains each term in context.
Notify me at launchEducational content. It is not investment advice. Crypto-assets carry a high risk that can go as far as the total loss of capital.