 Metena
Tokenomics: definition and unlock schedules
The economics of an asset: quantity issued, unlock schedule, distribution, uses. It sheds light on its long-term value.
Definition
A token’s tokenomics answers three questions: how many units will exist, who holds them, and when they can be sold. The last two often matter more than the first.
Tokens reserved for the team and investors are usually locked for a few months (the “cliff”), then released gradually. At each unlock, circulating supply grows. If demand does not keep up, the price absorbs that new supply.
The schedule is usually public in the project’s documentation. Checking it before buying avoids discovering afterwards that a large share of tokens hits the market the following month.
How to read the chart
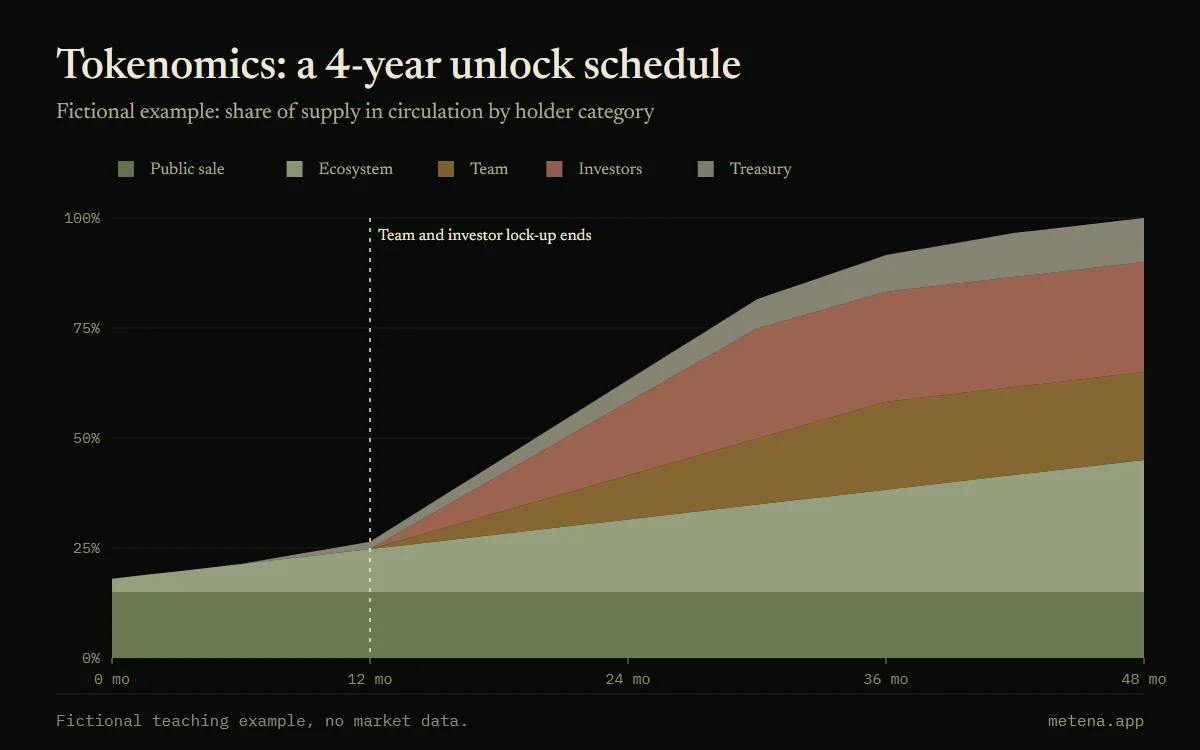
The chart describes a fictional token of one billion units. Each colour is a category of holders; the total height is the share of supply already unlocked.
The dotted line marks the end of the team and investor lock-up, at month 12: the slope steepens afterwards.
Worked example
In this fictional example, 18% of tokens circulate at launch and 26% after one year. The month after the lock-up ends, circulating supply reaches 29%, then 63% after two years: it more than doubled in twelve months.
In Metena
In Metena, each coin’s page shows the circulating supply, the maximum supply when there is one, and the fully diluted valuation: what the asset would be worth if every planned token were already in circulation.
Notify me at launchRelated terms
- Thesis
- Your reason for investing, written down: why you buy, over what horizon, and what has to happen for you to be right. A clear thesis stops you improvising when the market moves.
- On-chain
- Describes data read directly from the blockchain: active addresses, transfers, flows to exchanges. It shows a network’s real usage, not just its price.
- BTC dominance
- Bitcoin’s share of the total crypto market capitalization. When it rises, it is often at the expense of other cryptocurrencies.
- Stablecoin
- A crypto-asset designed to hold a stable value, usually pegged to a currency such as the dollar. Often used as a reserve so you are not 100% invested.



Put these ideas into practice.
Write your strategy in a few minutes: Metena analyses it when you ask and explains each term in context.
Notify me at launchEducational content. It is not investment advice. Crypto-assets carry a high risk that can go as far as the total loss of capital.