 Metena
DCA: definition and a bitcoin simulation
Investing a fixed amount at regular intervals, for example every week, whatever the price. It smooths your entry price and stops you hunting for the “right moment”.
Definition
With DCA, you buy for the same amount at every interval. When the price falls, that amount buys more units; when it rises, it buys fewer. Your average cost becomes the average over the whole period.
The method removes a hard decision: when to get in. It does not protect you from a decline: if the asset loses value for good, every purchase loses with it. It assumes a conviction over a long horizon, and holding it through the lows.
How to read the chart
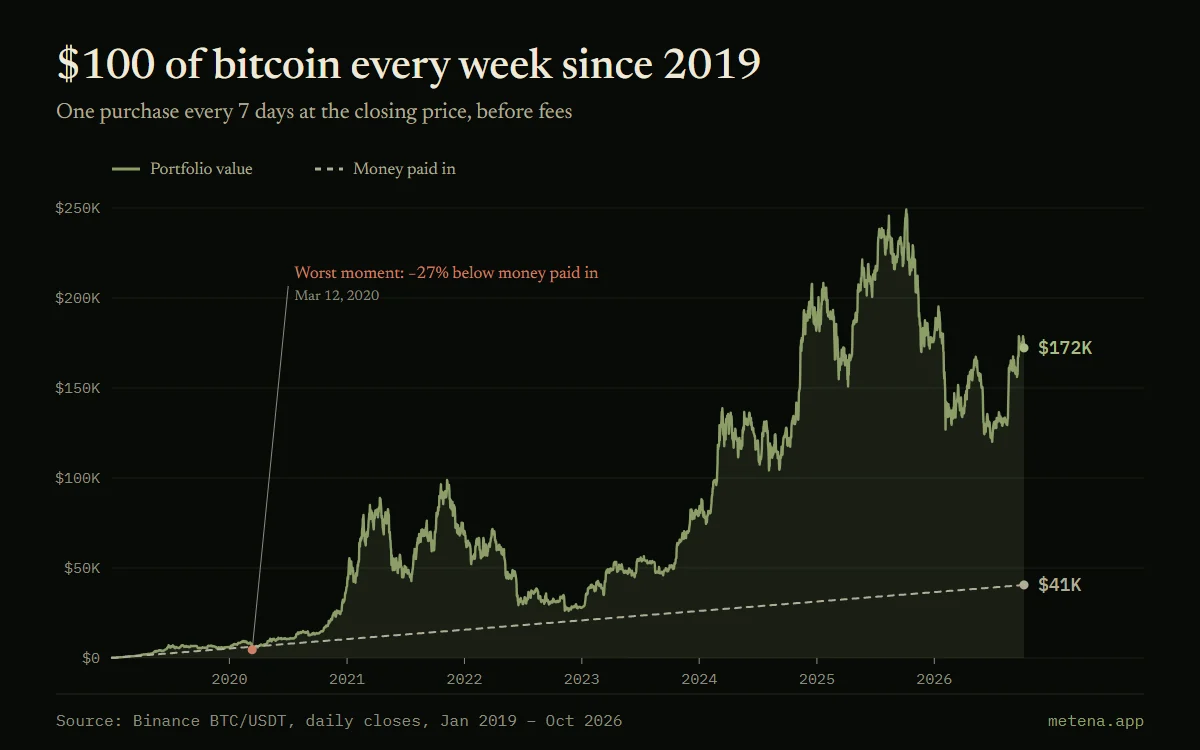
The dotted line rises in steps: it is the money paid in, $100 more every 7 days. The solid line is the value of the bitcoin accumulated, at that day’s price.
When the solid line drops below the dotted line, the portfolio is worth less than what was paid in. The red dot marks the moment when that gap was widest.
Worked example
From January 2019 to 7 October 2026: 406 purchases of $100, so $40,600 paid in. On 7 October 2026, the bitcoin accumulated is worth $172,281. The worst moment came on 12 March 2020: $6,300 paid in was worth only $4,599, or −27%. Past results do not predict future results.
In Metena
In Metena, a DCA strategy is written with its amount, its frequency and its stop conditions. The backtest replays those rules over the price history and shows the periods when the portfolio fell below the money paid in.
Notify me at launchRelated terms
- Rebalancing
- Adjusting the portfolio to get back to the planned allocation when one holding has risen or fallen too far compared with the others.
- Maximum drawdown
- The largest fall, as a percentage, from a peak to the low that follows. It measures what you must be able to withstand without abandoning your strategy.
- Backtest
- Replaying a strategy on past data to measure what it would have delivered. Useful for testing rules, but the past does not predict the future.
- Thesis
- Your reason for investing, written down: why you buy, over what horizon, and what has to happen for you to be right. A clear thesis stops you improvising when the market moves.


Related guides
- Building a crypto strategy from A to Z
- Thesis, allocation, position sizing, entry and exit rules, testing: the parts of a written crypto strategy, in the order in which they are decided.
- Bitcoin DCA: what seven years of data show
- Investing a fixed amount in bitcoin every week: real results since 2019, comparison with a lump sum, the worst time to start and the average cost.



Put these ideas into practice.
Write your strategy in a few minutes: Metena analyses it when you ask and explains each term in context.
Notify me at launchEducational content. It is not investment advice. Crypto-assets carry a high risk that can go as far as the total loss of capital.