 Metena
Crypto backtest: definition and bitcoin example
Replaying a strategy on past data to measure what it would have delivered. Useful for testing rules, but the past does not predict the future.
Definition
A backtest applies written rules to the price history, day after day, as if you had followed them. It gives a return, a maximum drawdown and the time spent invested.
Its results depend on the period chosen, on fees, and above all on one trap: adjusting the rules until they fit the past. A rule optimised on history can fail as soon as it meets a new market. A good backtest tests the rule on a period that was not used to tune it.
How to read the chart
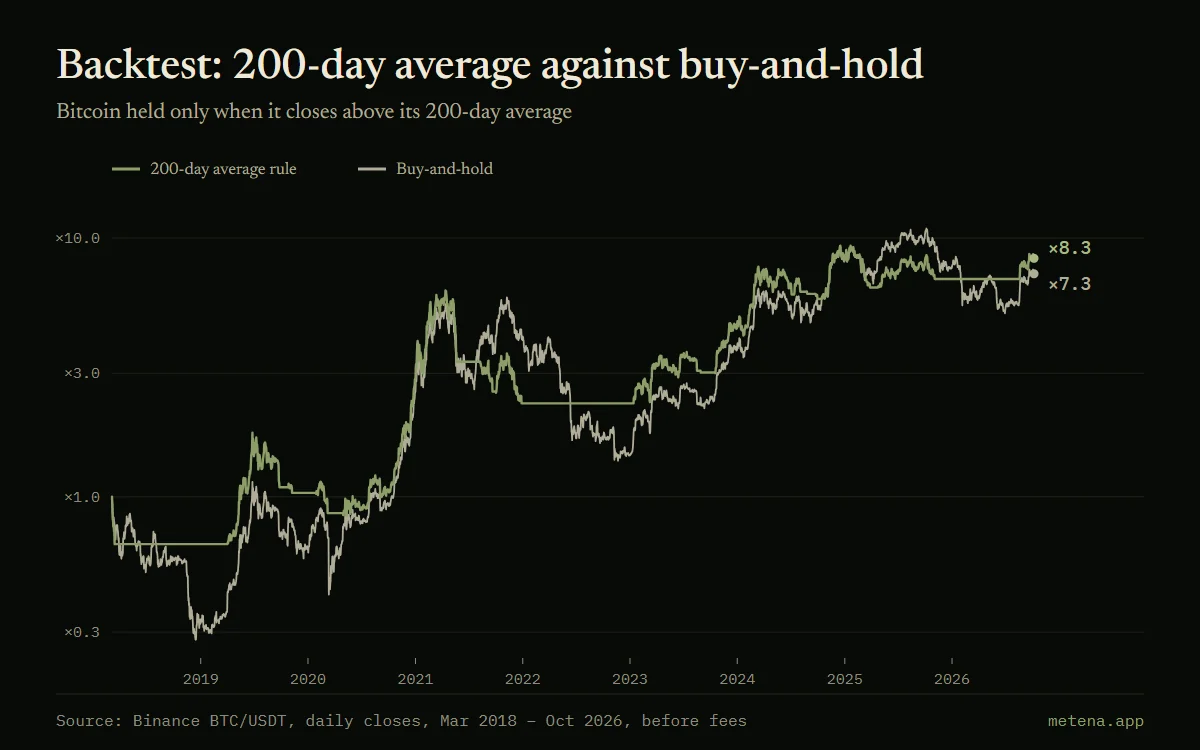
Both curves start at 1 (the initial capital) on a logarithmic scale. In grey, buy-and-hold BTC. In green, the rule: hold BTC only if the previous day’s close is above its 200-day average, otherwise stay in dollars.
The labels on the right give each approach’s final multiple.
Worked example
From 5 March 2018 to 7 October 2026, before fees: buy-and-hold multiplies capital by 7.3 with a maximum drawdown of −77%. The 200-day average rule multiplies it by 8.3 with a maximum drawdown of −63%, while invested 52% of the time. With fees and over another period, the gap changes.
In Metena
Metena’s backtest replays your strategy as written, then puts it through a Monte Carlo simulation and a validation on a period that was not used to tune it.
Notify me at launchRelated terms
- Monte Carlo simulation
- A method that generates thousands of possible paths from your rules, to see the range of outcomes instead of a single scenario. Each path is a possible future, not a forecast.
- Maximum drawdown
- The largest fall, as a percentage, from a peak to the low that follows. It measures what you must be able to withstand without abandoning your strategy.
- Sharpe ratio
- Return relative to the volatility endured. The higher it is, the more the return was earned with moderate turbulence.
- Moving average (SMA, EMA)
- The average price over a given period: it smooths out noise and brings out the trend. The EMA gives more weight to recent prices.


Related guides
- Building a crypto strategy from A to Z
- Thesis, allocation, position sizing, entry and exit rules, testing: the parts of a written crypto strategy, in the order in which they are decided.
- Bitcoin DCA: what seven years of data show
- Investing a fixed amount in bitcoin every week: real results since 2019, comparison with a lump sum, the worst time to start and the average cost.
- How to read a crypto backtest without being fooled
- Return, maximum drawdown, overfitting, Monte Carlo: how to read the results of a crypto strategy backtest, with real bitcoin examples.



Put these ideas into practice.
Write your strategy in a few minutes: Metena analyses it when you ask and explains each term in context.
Notify me at launchEducational content. It is not investment advice. Crypto-assets carry a high risk that can go as far as the total loss of capital.