 Metena
Bitcoin DCA: what seven years of data show
DCA means buying the same amount at regular intervals, whatever the price. The method is simple to apply; its results are harder to anticipate. This guide uses real bitcoin price data since 2017 to answer four questions: what a DCA delivered, whether it beats a lump sum, what a DCA started at the worst moment is worth, and what happens to the average cost.
What $100 a week since 2019 delivered
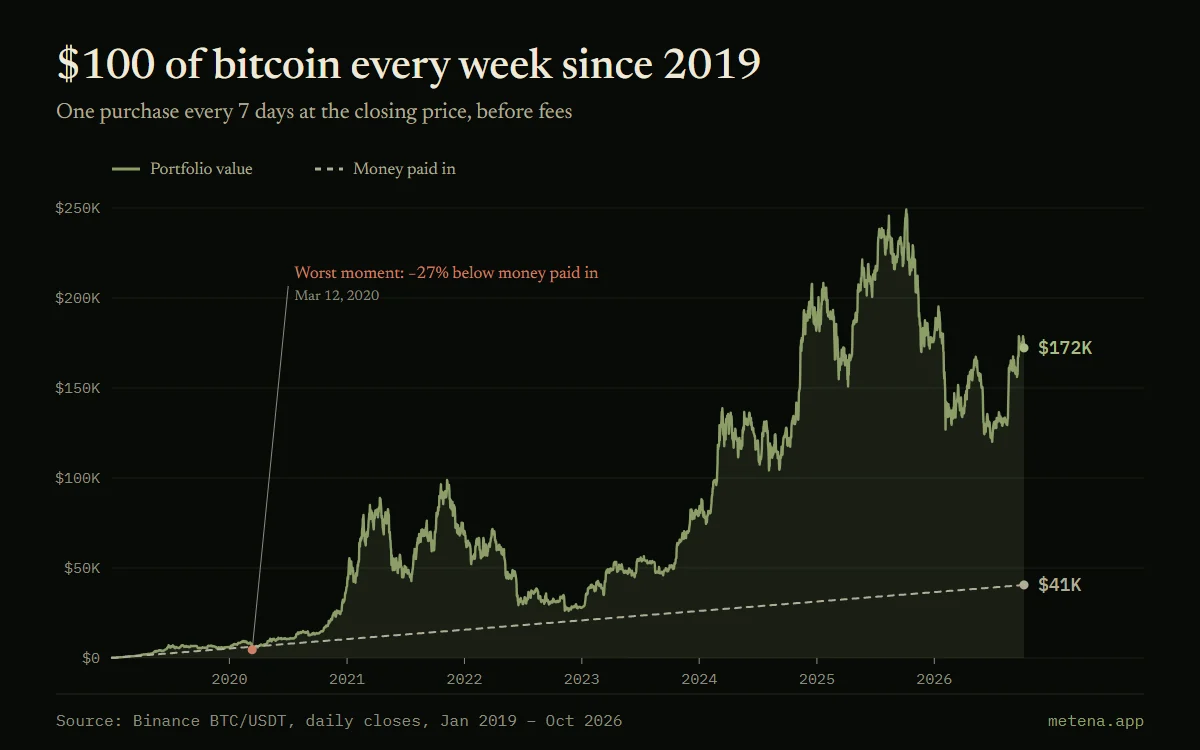
Take a $100 bitcoin purchase every 7 days, at the closing price, from 1 January 2019. By 7 October 2026, that makes 406 purchases and $40,600 paid in. The bitcoin accumulated is then worth $172,281.
The path was not smooth. On 12 March 2020, after fourteen months of purchases, the $6,300 paid in was worth only $4,599: −27%. An investor who stopped that day would have booked a loss. One who kept going bought at the low of the period.
DCA or lump sum: which wins?
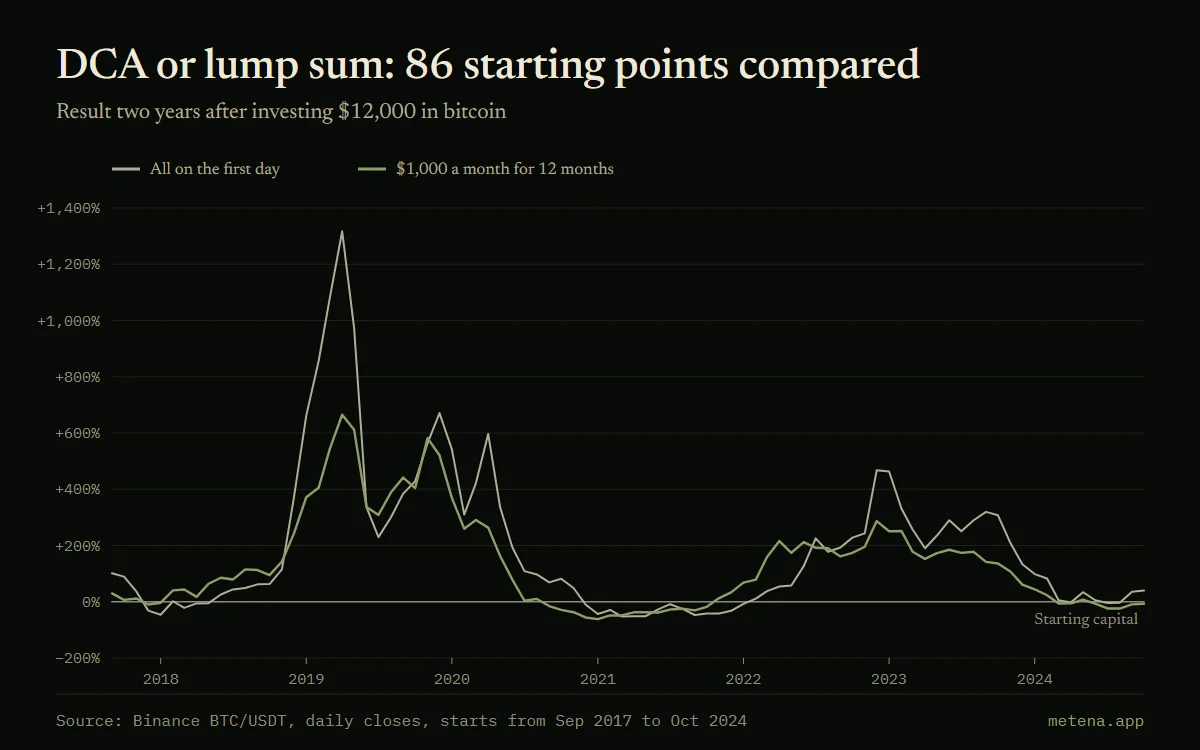
The question comes up often. To answer it, compare two ways of investing $12,000: all on the first day, or $1,000 a month for twelve months. Each is measured two years after the start, for every possible starting month between September 2017 and October 2024: 86 cases.
The lump sum wins in 63% of cases. That is expected for an asset that rose a lot: money invested earlier benefits longer from the rise. But the gap flips depending on timing. Starting in March 2021, the lump sum loses 52% over two years and the DCA 49%. Starting in January 2021, the DCA loses more (−62% against −43%), because it kept buying during the climb to the November top.
Across all starting points, each method ends at a loss after two years in about one case in four. DCA does not remove market risk. It spreads the entry point and makes the decision bearable: you do not have to pick a day.
Starting at the worst moment
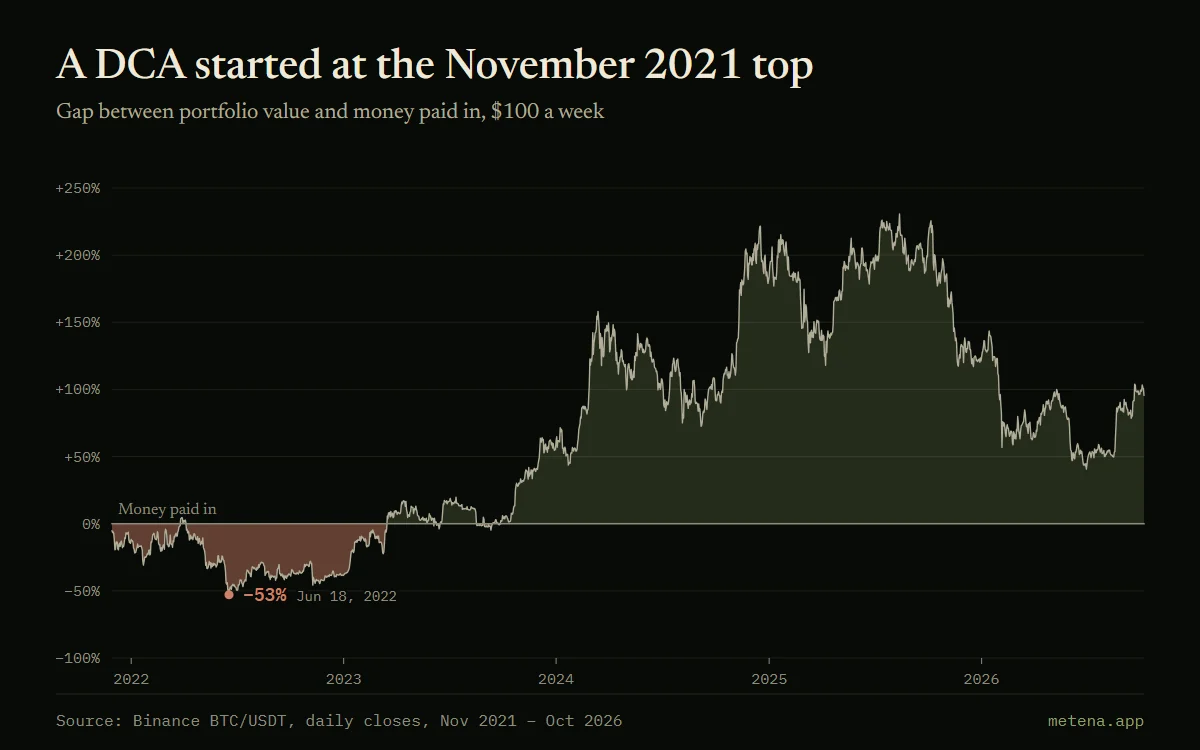
The most feared scenario is starting just before a long decline. On 8 November 2021, bitcoin closed at its cycle high, $67,526. A $100-a-week DCA started that day went through the whole of the 2022 decline.
On 18 June 2022, that portfolio was worth 53% less than the money paid in. It only got back above on 17 March 2023, and spent 498 days at a loss in total. On 7 October 2026, the $25,700 paid in is worth $50,229.
This is the point that needs the most preparation: a well-chosen DCA can spend a year and a half under water. If you do not know in advance what you will do during that time, the strategy may stop at the worst moment.
The average cost
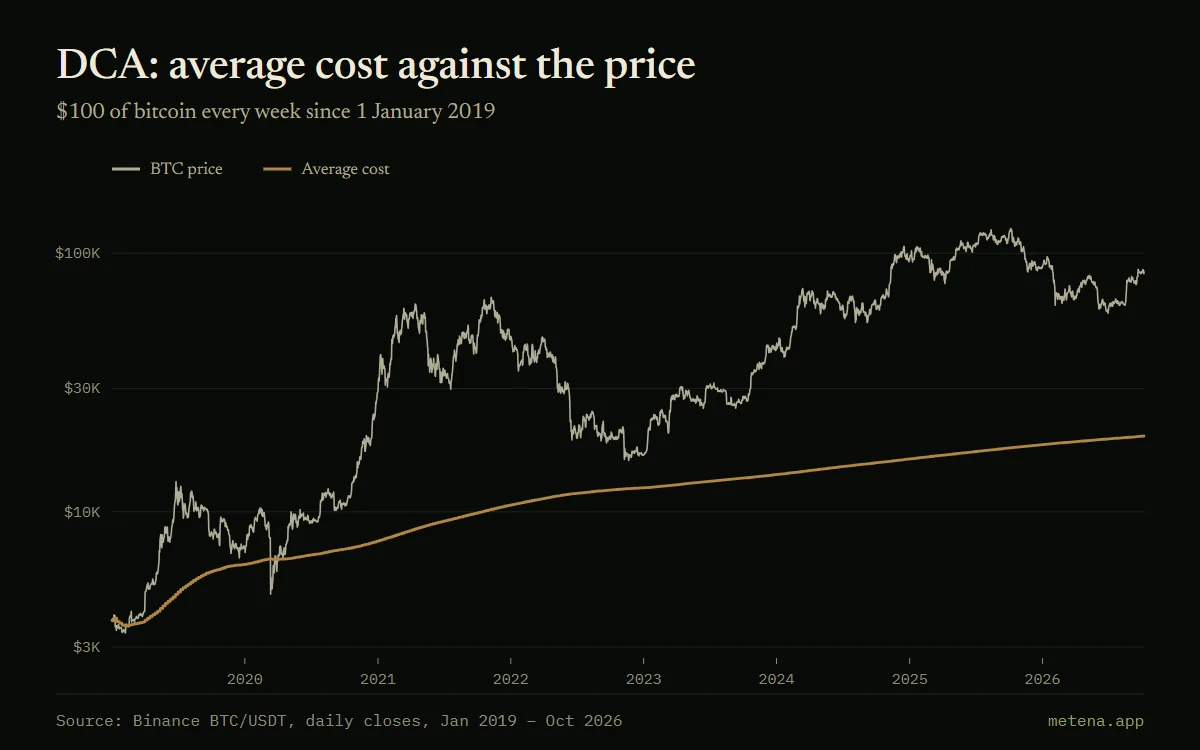
Each purchase happens at a different price. The average cost is the money paid in divided by the number of bitcoins accumulated. With a fixed amount, you buy more units when the price is low, which pulls this average cost down.
For the DCA started in January 2019, the average cost is $19,636 on 7 October 2026, against a price of $83,322. The price has been below this average cost on only 54 days, the last time on 31 March 2020. The longer a DCA runs, the slower its average cost moves: each new purchase weighs less in the average.
Three mistakes that cancel out the point of a DCA
The first is pausing the purchases during a decline. It is during a decline that the fixed amount buys the most units and that the average cost comes down fastest.
The second is raising the amount after a strong rise, when confidence is at its highest. The DCA then turns into concentrated buying near the tops. If the amount has to change, let it be under a written rule, for example a review once a year.
The third is forgetting fees. On a $25 purchase, a $1 minimum fee costs 4% every time. A larger monthly purchase often works out cheaper than a smaller weekly one, for a very similar result.
A DCA does not say when to sell
DCA settles the entry and leaves the exit open. Without a selling rule, the position grows until it exceeds its planned share of the portfolio, and the question of selling comes up at the worst moment: after a strong rise, or in the middle of a decline.
Two rules complete a DCA. Take-profit levels sell a fraction of the position at levels set in advance. A cap stops the purchases when the asset already weighs its intended share of the portfolio.
What to decide before starting
A DCA comes down to three settings: amount, frequency and duration. The amount must be sustainable through a decline of several months without touching your emergency savings. Frequency changes the result little over several years: weekly or monthly, the gap stays small compared with market moves.
The harder decisions are the conditions for stopping and changing course. Stopping if the thesis is invalidated is a rule. Stopping because the portfolio is down 40% is another, which often means selling at the bottom. Both deserve to be written before the first purchase, not during the decline.
These figures are past results, before fees and taxes. They describe what a method delivered on one asset, not what it will deliver.
In Metena
In Metena, a DCA strategy is written with its amount, its frequency and its stop conditions. The backtest replays those rules over the price history and shows the periods when the portfolio fell below the money paid in.
Notify me at launchGlossary terms
- DCA (Dollar-Cost Averaging)
- Investing a fixed amount at regular intervals, for example every week, whatever the price. It smooths your entry price and stops you hunting for the “right moment”.
- Maximum drawdown
- The largest fall, as a percentage, from a peak to the low that follows. It measures what you must be able to withstand without abandoning your strategy.
- Thesis
- Your reason for investing, written down: why you buy, over what horizon, and what has to happen for you to be right. A clear thesis stops you improvising when the market moves.
- Invalidation condition
- The precise fact that would prove your thesis wrong and trigger your exit, for example “I exit if BTC closes two weeks below $20,000”. Writing it in advance stops you rationalizing it later.
- Backtest
- Replaying a strategy on past data to measure what it would have delivered. Useful for testing rules, but the past does not predict the future.


Related guides
- Building a crypto strategy from A to Z
- Thesis, allocation, position sizing, entry and exit rules, testing: the parts of a written crypto strategy, in the order in which they are decided.
- How to read a crypto backtest without being fooled
- Return, maximum drawdown, overfitting, Monte Carlo: how to read the results of a crypto strategy backtest, with real bitcoin examples.
- Writing your investment thesis and invalidation conditions
- How to write a crypto investment thesis, turn it into rules and set invalidation conditions, with the real examples of Terra-LUNA and FTX in 2022.
- Crypto risk management: position sizing, leverage and liquidation
- How much to put in each position, what leverage really changes and why diversifying across cryptocurrencies protects little: real bitcoin and ether examples.
- When to sell your crypto: writing your exit plan
- Take-profit levels, stop, invalidation condition, rebalancing: four reasons to sell that should be written before buying, with worked examples.



Put these ideas into practice.
Write your strategy in a few minutes: Metena analyses it when you ask and explains each term in context.
Notify me at launchEducational content. It is not investment advice. Crypto-assets carry a high risk that can go as far as the total loss of capital.