 Metena
Maximum drawdown: definition and bitcoin example
The largest fall, as a percentage, from a peak to the low that follows. It measures what you must be able to withstand without abandoning your strategy.
Definition
Drawdown is always measured from the highest point reached so far. If a portfolio climbs to $10,000 and then falls back to $6,000, its drawdown is −40%, even if it is still above its purchase price.
Maximum drawdown is the deepest of these falls over a period. It is the most concrete risk measure: it tells you how much of your capital you would have watched disappear, at the worst moment, had you bought at the top.
Climbing out of a hole takes more than falling into it. After −50%, you need +100% to get back to where you started; after −83%, you need +495%.
How to read the chart
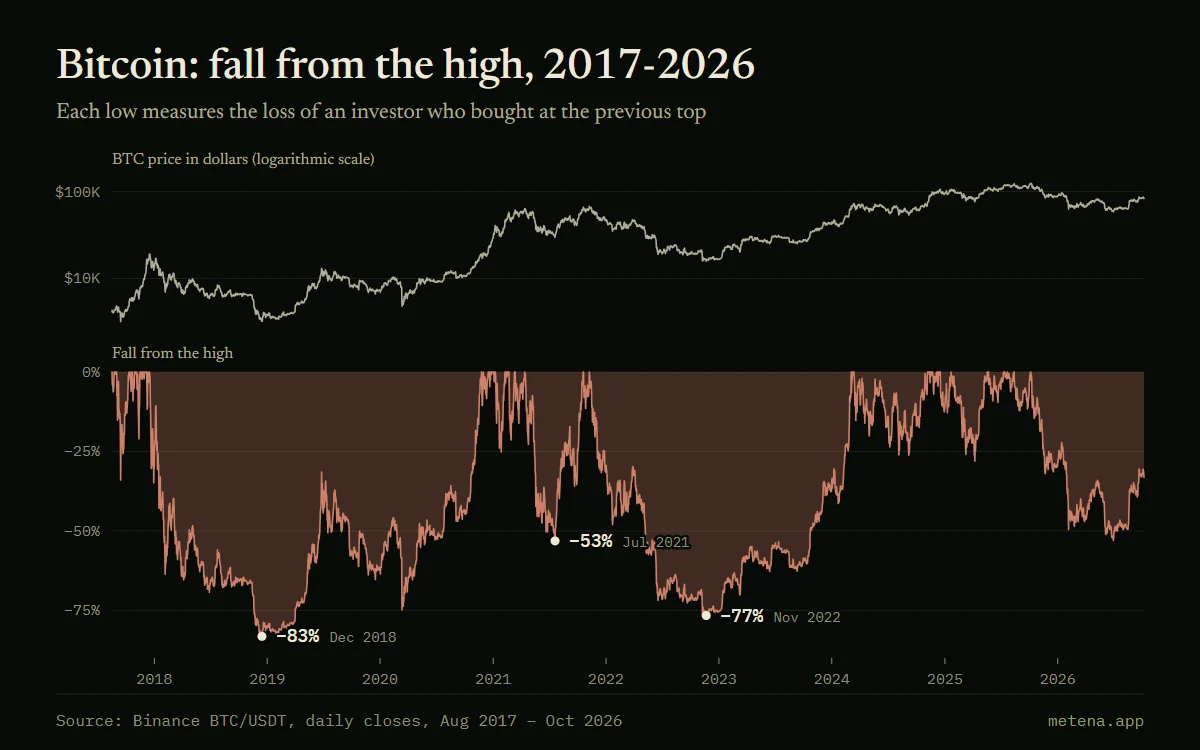
At the top, the bitcoin price on a logarithmic scale: the same vertical distance represents the same percentage move, whether the price is $4,000 or $100,000.
At the bottom, the fall from the previous high. The line touches 0% at every new record, then drops to the next low. The three deepest lows are labelled with their date.
Worked example
An investor who bought at the 16 December 2017 top ($19,103 at the close) saw the position fall to $3,212 on 15 December 2018: −83%. One who bought on 8 November 2021 ($67,526) went down to $15,781 on 21 November 2022: −77%. On 7 October 2026, bitcoin trades at $83,322, 33% below its high.
In Metena
Metena calculates the drawdown of your real positions, excluding the effect of your withdrawals, and asks you to state in your strategy the largest fall you accept. The diagnostic then checks that your rules hold up against historical lows.
Notify me at launchRelated terms
- Volatility
- The size of an asset’s price swings. High volatility means large moves, up as well as down.
- Backtest
- Replaying a strategy on past data to measure what it would have delivered. Useful for testing rules, but the past does not predict the future.
- Stress test
- Simulating your rules through a historical shock, such as the March 2020 crash, the LUNA collapse or the FTX bankruptcy, to see what they would have absorbed.
- Sharpe ratio
- Return relative to the volatility endured. The higher it is, the more the return was earned with moderate turbulence.


Related guides
- Bitcoin DCA: what seven years of data show
- Investing a fixed amount in bitcoin every week: real results since 2019, comparison with a lump sum, the worst time to start and the average cost.
- How to read a crypto backtest without being fooled
- Return, maximum drawdown, overfitting, Monte Carlo: how to read the results of a crypto strategy backtest, with real bitcoin examples.
- Crypto risk management: position sizing, leverage and liquidation
- How much to put in each position, what leverage really changes and why diversifying across cryptocurrencies protects little: real bitcoin and ether examples.



Put these ideas into practice.
Write your strategy in a few minutes: Metena analyses it when you ask and explains each term in context.
Notify me at launchEducational content. It is not investment advice. Crypto-assets carry a high risk that can go as far as the total loss of capital.