 Metena
Crypto risk management: position sizing, leverage and liquidation
The size of a position often matters more than the choice of asset. A good idea in too large a quantity can ruin a portfolio; an average idea sized well leaves room to be wrong. This guide starts from the basic money management rule, then looks at what leverage and the correlation between cryptocurrencies change in the calculation.
Start from the loss you accept
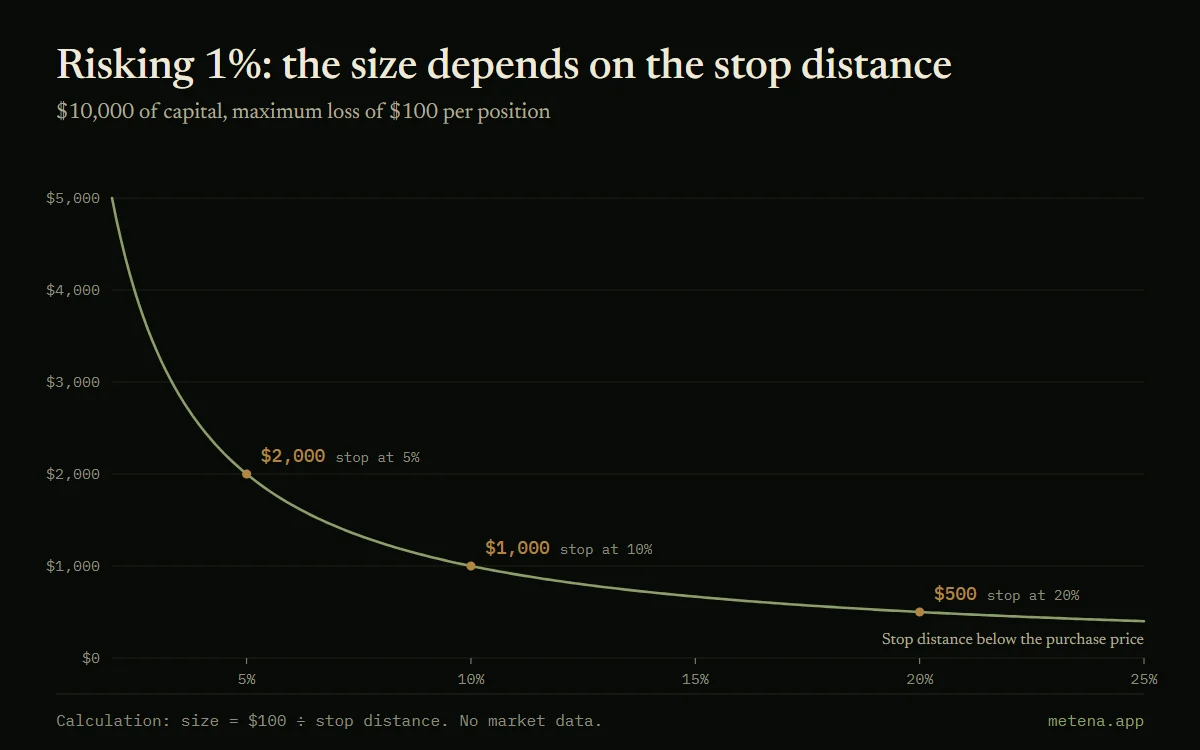
The most common rule caps the possible loss on a position at a small share of capital, often 1% to 2%. The size then follows from the distance to the exit point: accepted risk ÷ stop distance.
With $10,000 and 1% risk, or $100: a stop 5% below the purchase price allows a $2,000 position, a stop at 20% a $500 position. On an asset as volatile as bitcoin, tight stops are hit by everyday noise; wide stops require smaller positions.
The share of crypto in the portfolio
For a long-term investor without a stop, the same logic applies at portfolio level: what total decline can you go through without selling? The answer sets the share to expose.
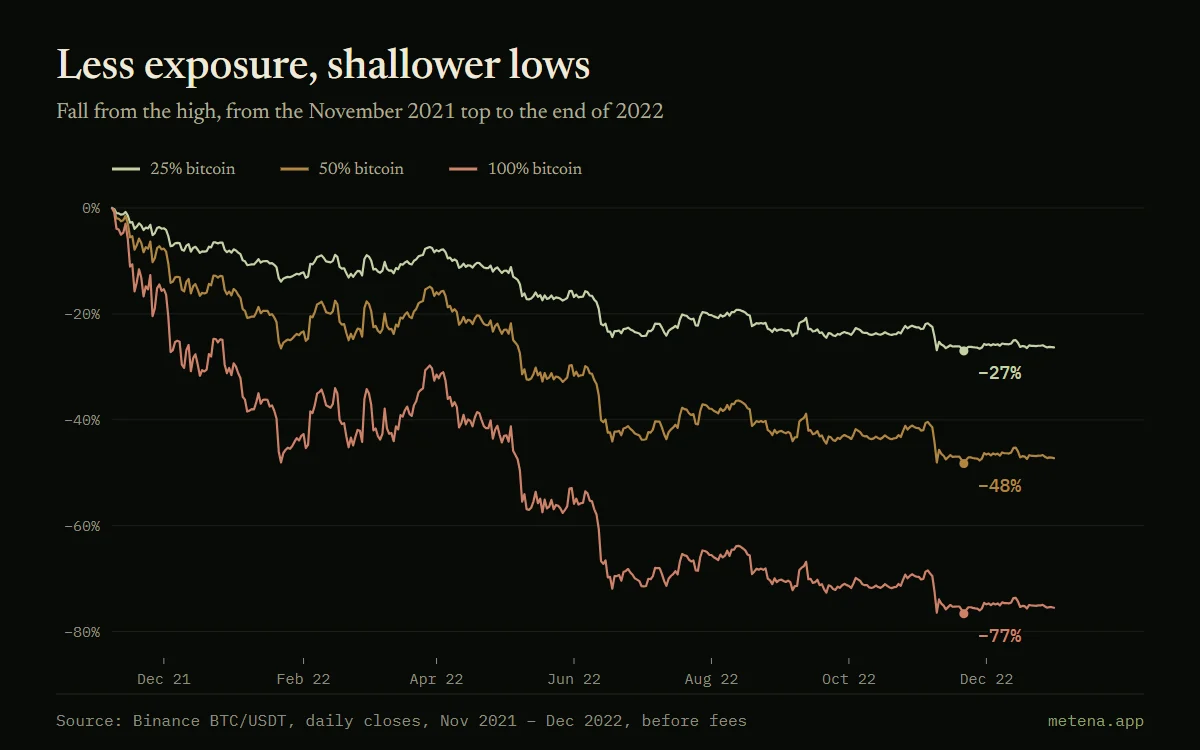
Between the top of 8 November 2021 and the end of 2022, a 100% bitcoin portfolio lost up to 77%. With 50% bitcoin and 50% dollars, rebalanced every month, the maximum drawdown falls to 48%. With 25% bitcoin, to 27%. Reducing exposure does not change the market’s direction; it changes what you have to absorb.
Leverage brings the exit closer
Leverage increases the size of the position without increasing capital. It multiplies gains and losses, and adds a risk the unleveraged position does not have: liquidation, meaning the position is closed automatically when the loss approaches the collateral.
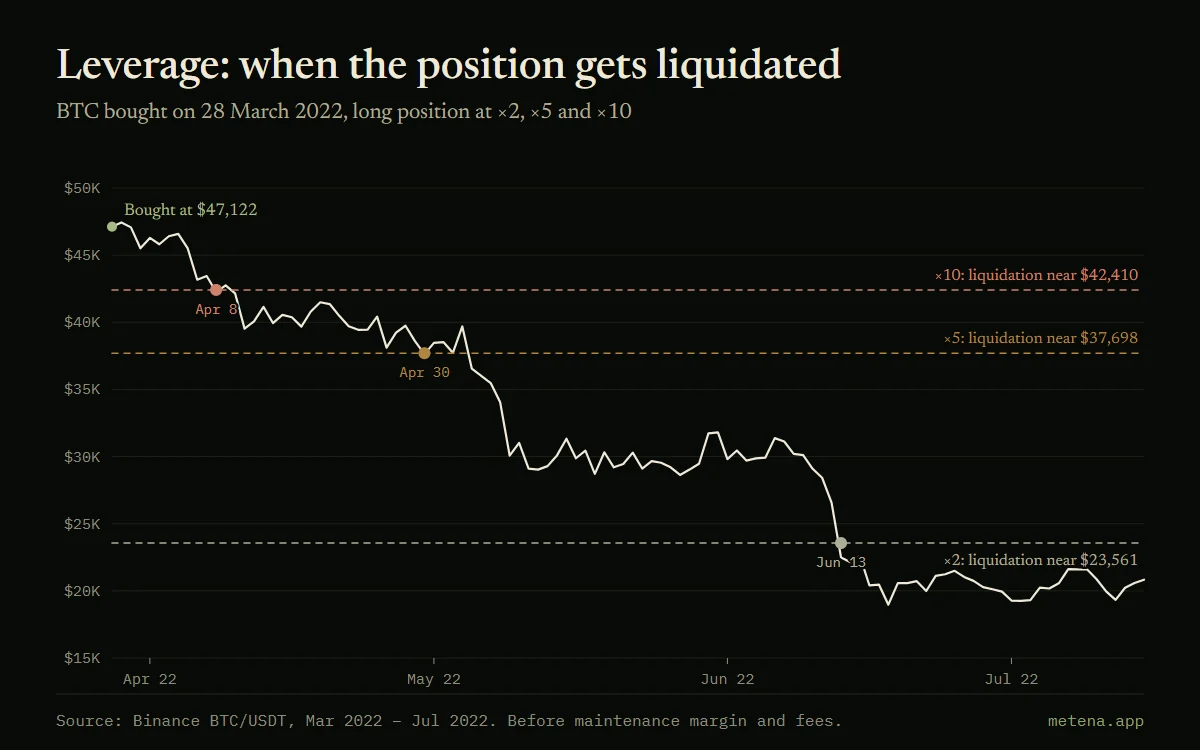
A bitcoin purchase on 28 March 2022, at $47,122, shows the gap. At ×10, the position is liquidated on 8 April. At ×5, on 30 April. At ×2, on 13 June. Without leverage, it loses up to 63% over the period, but stays open and benefits from the later rebound. With leverage, a temporary loss becomes permanent.
Diversifying across cryptos protects little
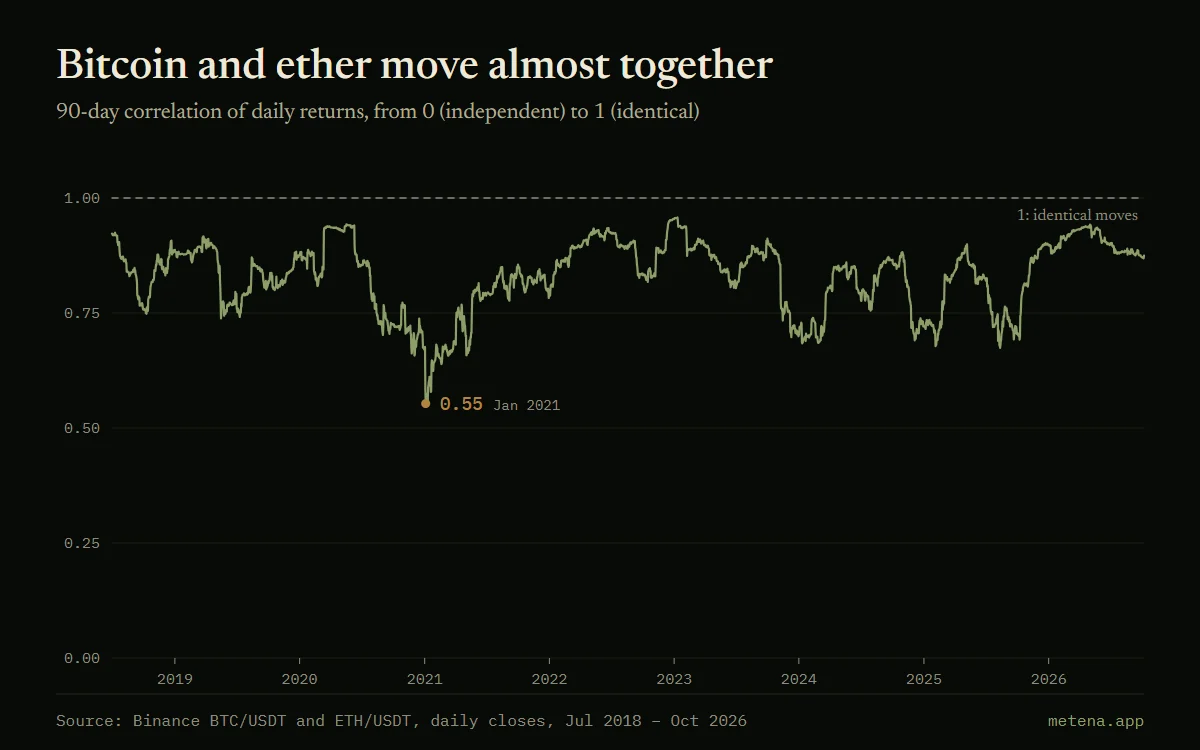
Spreading a portfolio across several cryptocurrencies gives an impression of diversification. The numbers temper it: since mid-2018, the 90-day correlation between the daily returns of bitcoin and ether has averaged 0.83, and has never dropped below 0.55, on a scale where 1 means they always move together.
It rises during crises, precisely when diversification should help: 0.94 in mid-April 2020 after the March crash, 0.92 in mid-June 2022 after Terra’s collapse, 0.88 at the end of November 2022 after FTX. On 7 October 2026, it stands at 0.87. To reduce the risk of a crypto portfolio, the share of crypto in the total matters more than the number of cryptos held.
A run of losses is normal
Even a good strategy strings losses together. With one winning idea in two, the probability of losing five times in a row is about 3%. Over a few hundred positions, such a run becomes almost certain.
This is what the 1% rule protects against. Ten losses in a row at 1% leave 90% of capital; at 10% per position, 35% is left. Climbing back costs more than falling: after a 50% loss, it takes a 100% gain to return to the starting point.
Fixed stop or volatility-based stop
A stop at a fixed distance, 10% for example, treats every asset the same way. Yet an altcoin can move 10% on an ordinary day when bitcoin moves 3%.
The ATR measures the average range of recent moves. Placing the stop at twice the ATR below the entry price adapts the distance to the asset, and the sizing formula does the rest: the more volatile the asset, the wider the stop and the smaller the position. The risk in dollars stays the same from one position to the next.
The limits to write down
Three limits are enough for most strategies. The maximum share of crypto in your wealth, set from the decline you can go through. The maximum share of any single asset other than bitcoin. The maximum leverage, and for many investors the right answer is none.
Write them down before you need them, and check them after every strong rise: that is when winning positions quietly outgrow their planned size.
The examples in this guide are historical, before fees and taxes. They are not investment advice.
In Metena
In Metena, money management is part of the Constitution: maximum size per position, reserve, accepted decline. The diagnostic flags positions that exceed these limits.
Notify me at launchGlossary terms
- Money management
- Managing the size of your positions and your exposure: how much to risk per holding, what reserve to keep, which limits never to cross.
- Leverage
- Borrowing to take a position larger than your capital. It amplifies gains and losses alike and can lead to the position being liquidated.
- Maximum drawdown
- The largest fall, as a percentage, from a peak to the low that follows. It measures what you must be able to withstand without abandoning your strategy.
- Rebalancing
- Adjusting the portfolio to get back to the planned allocation when one holding has risen or fallen too far compared with the others.
- Volatility
- The size of an asset’s price swings. High volatility means large moves, up as well as down.


Related guides
- Building a crypto strategy from A to Z
- Thesis, allocation, position sizing, entry and exit rules, testing: the parts of a written crypto strategy, in the order in which they are decided.
- Bitcoin DCA: what seven years of data show
- Investing a fixed amount in bitcoin every week: real results since 2019, comparison with a lump sum, the worst time to start and the average cost.
- How to read a crypto backtest without being fooled
- Return, maximum drawdown, overfitting, Monte Carlo: how to read the results of a crypto strategy backtest, with real bitcoin examples.
- Writing your investment thesis and invalidation conditions
- How to write a crypto investment thesis, turn it into rules and set invalidation conditions, with the real examples of Terra-LUNA and FTX in 2022.
- When to sell your crypto: writing your exit plan
- Take-profit levels, stop, invalidation condition, rebalancing: four reasons to sell that should be written before buying, with worked examples.



Put these ideas into practice.
Write your strategy in a few minutes: Metena analyses it when you ask and explains each term in context.
Notify me at launchEducational content. It is not investment advice. Crypto-assets carry a high risk that can go as far as the total loss of capital.