 Metena
Sharpe ratio: definition, calculation, BTC vs ETH
Return relative to the volatility endured. The higher it is, the more the return was earned with moderate turbulence.
Definition
The Sharpe ratio divides the average return by its volatility. Two investments that earn the same do not have the same Sharpe if one gets there through much stronger swings.
In traditional finance, the risk-free rate is subtracted first. Here it is set to 0 for simplicity. Above 1, the return was earned with reasonable volatility; below 0.5, the swings weighed heavily against the gain.
The Sharpe ratio treats sharp rises like sharp falls. For a measure that only penalises the downside, use the Sortino ratio.
How to read the chart
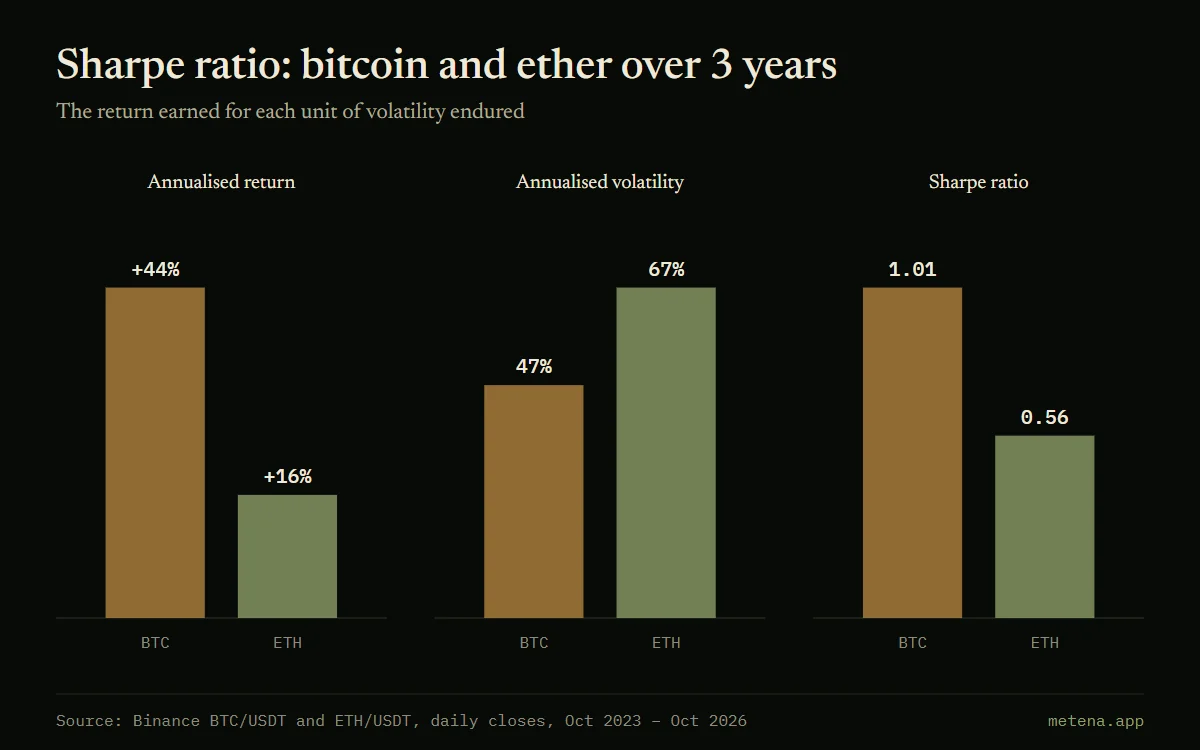
Three panels, three measures over the same 3-year period: annualised return, annualised volatility and the Sharpe ratio, which is roughly the ratio of the two.
BTC in gold, ETH in green.
Worked example
From 8 October 2023 to 7 October 2026, bitcoin returned 44% a year with 47% volatility: a Sharpe of 1.01. Ether returned 16% a year with 67% volatility: a Sharpe of 0.56. The Sharpe is calculated on daily returns, annualised over 365 days.
In Metena
Metena calculates the Sharpe of your actual portfolio and of your backtests, alongside the Sortino, volatility and maximum drawdown.
Notify me at launchRelated terms
- Volatility
- The size of an asset’s price swings. High volatility means large moves, up as well as down.
- Maximum drawdown
- The largest fall, as a percentage, from a peak to the low that follows. It measures what you must be able to withstand without abandoning your strategy.
- Backtest
- Replaying a strategy on past data to measure what it would have delivered. Useful for testing rules, but the past does not predict the future.
- Percentile (p5, p95)
- The 5th percentile is the value below which 5% of simulated scenarios fall; the 95th is the value only 5% exceed. They bound the low and high scenarios.


Related guides
- How to read a crypto backtest without being fooled
- Return, maximum drawdown, overfitting, Monte Carlo: how to read the results of a crypto strategy backtest, with real bitcoin examples.

Put these ideas into practice.
Write your strategy in a few minutes: Metena analyses it when you ask and explains each term in context.
Notify me at launchEducational content. It is not investment advice. Crypto-assets carry a high risk that can go as far as the total loss of capital.