 Metena
Monte Carlo simulation: definition and example
A method that generates thousands of possible paths from your rules, to see the range of outcomes instead of a single scenario. Each path is a possible future, not a forecast.
Definition
A backtest tells only one story: the one that happened. Monte Carlo builds thousands of others by reshuffling the observed moves, to see the range of what could have happened.
The result is a distribution, not a forecast. The simulation assumes the future resembles the past it uses; it contains no event that is not in that past.
How to read the chart
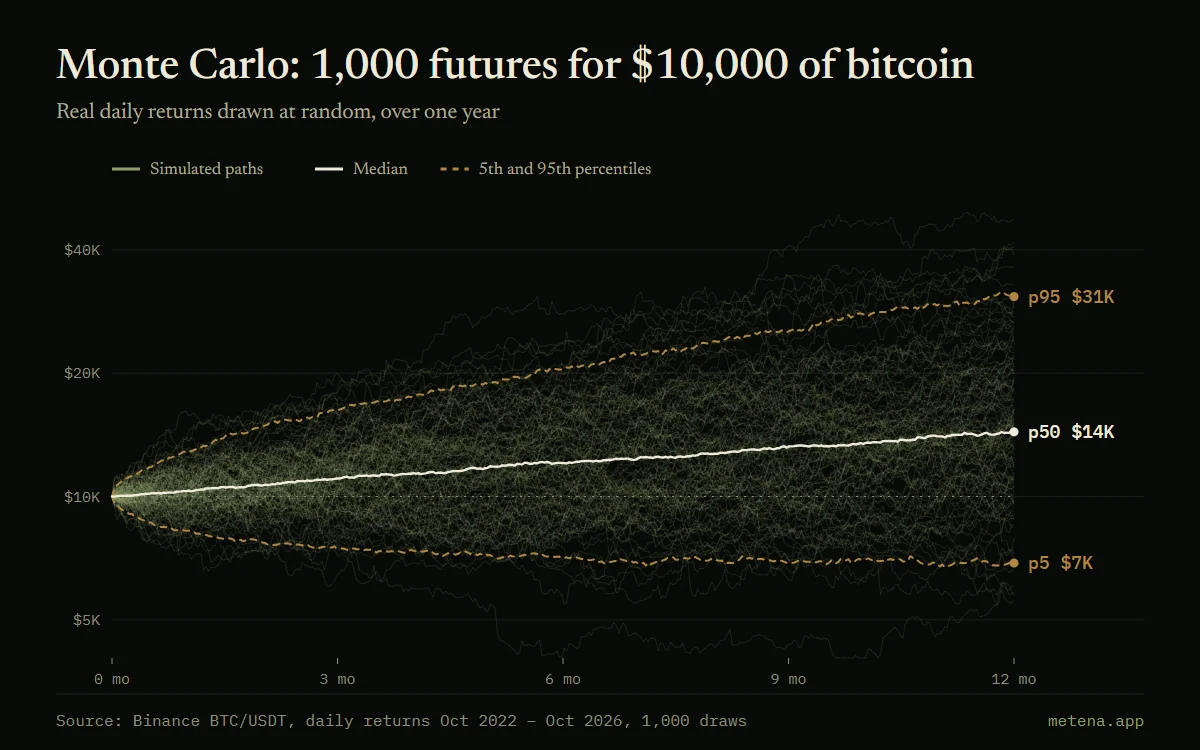
Each thin green line is a simulated path of $10,000 invested in bitcoin for a year (120 of the 1,000 simulated are drawn). The scale is logarithmic.
The bright line is the median: half the paths end above it. The dotted gold lines frame 90% of the scenarios, between the 5th and 95th percentiles.
Worked example
1,000 one-year paths, built by drawing bitcoin’s real daily returns between October 2022 and October 2026 at random. After a year, the median is $14,381, the 5th percentile $6,884 and the 95th $30,752. 20.5% of paths end below the starting $10,000.
In Metena
Metena’s backtest runs a Monte Carlo simulation on your strategy and shows percentiles of return, Sharpe and maximum drawdown, so you judge how solid a result is rather than a single number.
Notify me at launchRelated terms
- Percentile (p5, p95)
- The 5th percentile is the value below which 5% of simulated scenarios fall; the 95th is the value only 5% exceed. They bound the low and high scenarios.
- Backtest
- Replaying a strategy on past data to measure what it would have delivered. Useful for testing rules, but the past does not predict the future.
- Volatility
- The size of an asset’s price swings. High volatility means large moves, up as well as down.
- Stress test
- Simulating your rules through a historical shock, such as the March 2020 crash, the LUNA collapse or the FTX bankruptcy, to see what they would have absorbed.


Related guides
- How to read a crypto backtest without being fooled
- Return, maximum drawdown, overfitting, Monte Carlo: how to read the results of a crypto strategy backtest, with real bitcoin examples.

Put these ideas into practice.
Write your strategy in a few minutes: Metena analyses it when you ask and explains each term in context.
Notify me at launchEducational content. It is not investment advice. Crypto-assets carry a high risk that can go as far as the total loss of capital.