 Metena
Percentiles p5 and p95: definition and reading
The 5th percentile is the value below which 5% of simulated scenarios fall; the 95th is the value only 5% exceed. They bound the low and high scenarios.
Definition
A percentile ranks results. Among 1,000 scenarios sorted from worst to best, the 5th percentile (p5) is around the 50th, the median (p50) at the 500th, the 95th percentile (p95) around the 950th.
The p5 is useful for deciding: it describes a plausible bad scenario, not the worst possible one. If you cannot bear the p5, the strategy takes more risk than you think.
How to read the chart
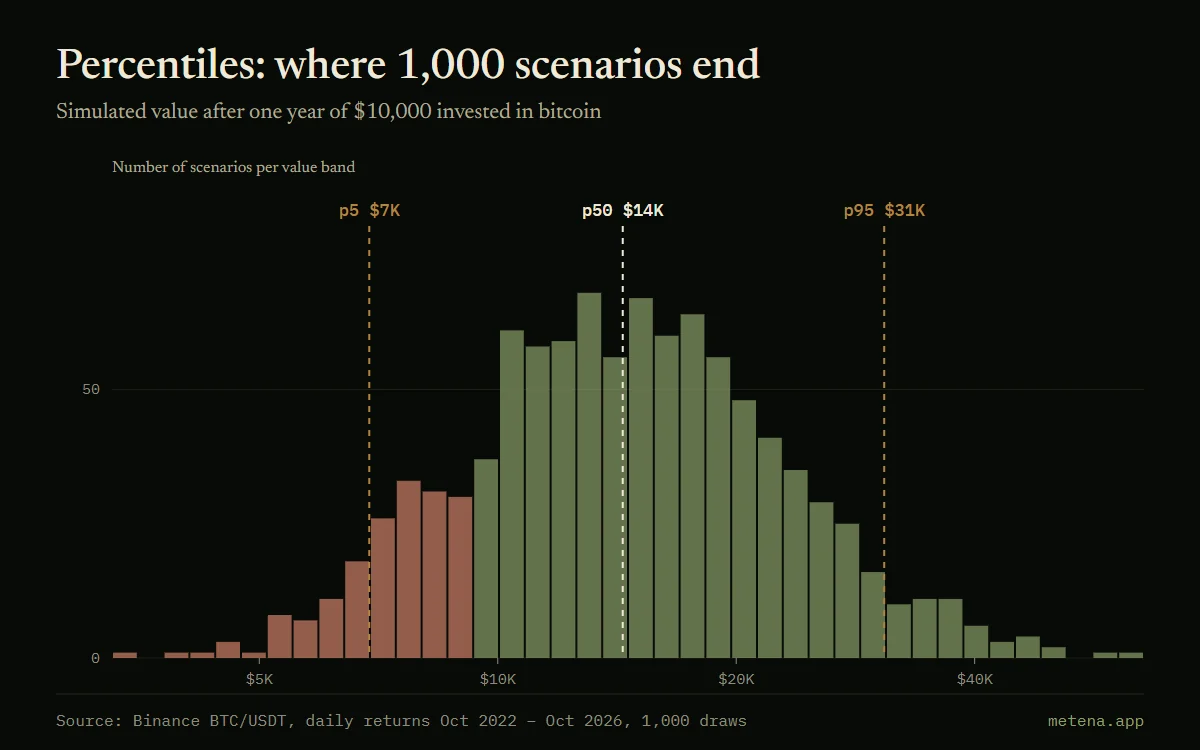
Each bar counts the scenarios that end in a value band, on the logarithmic horizontal axis. In red, the bands below the starting $10,000.
The three vertical lines mark the p5, the median and the p95.
Worked example
Across the 1,000 one-year paths simulated from bitcoin’s returns (October 2022 – October 2026): p5 at $6,884, median at $14,381, p95 at $30,752, for $10,000 invested. 205 scenarios out of 1,000 end at a loss.
In Metena
Metena’s Monte Carlo results are shown as percentiles: p5 for the adverse scenario, the median, p95 for the favourable one.
Notify me at launchRelated terms
- Monte Carlo simulation
- A method that generates thousands of possible paths from your rules, to see the range of outcomes instead of a single scenario. Each path is a possible future, not a forecast.
- Backtest
- Replaying a strategy on past data to measure what it would have delivered. Useful for testing rules, but the past does not predict the future.
- Maximum drawdown
- The largest fall, as a percentage, from a peak to the low that follows. It measures what you must be able to withstand without abandoning your strategy.
- Sharpe ratio
- Return relative to the volatility endured. The higher it is, the more the return was earned with moderate turbulence.


Related guides
- How to read a crypto backtest without being fooled
- Return, maximum drawdown, overfitting, Monte Carlo: how to read the results of a crypto strategy backtest, with real bitcoin examples.

Put these ideas into practice.
Write your strategy in a few minutes: Metena analyses it when you ask and explains each term in context.
Notify me at launchEducational content. It is not investment advice. Crypto-assets carry a high risk that can go as far as the total loss of capital.