 Metena
How to read a crypto backtest without being fooled
A backtest often shows a rising curve and a flattering multiple. That number alone says little. This guide takes a simple rule applied to bitcoin since 2018 and shows what to look at beyond the return: the losses endured, how the rule was chosen, and the range of possible outcomes.
An example: the 200-day moving average
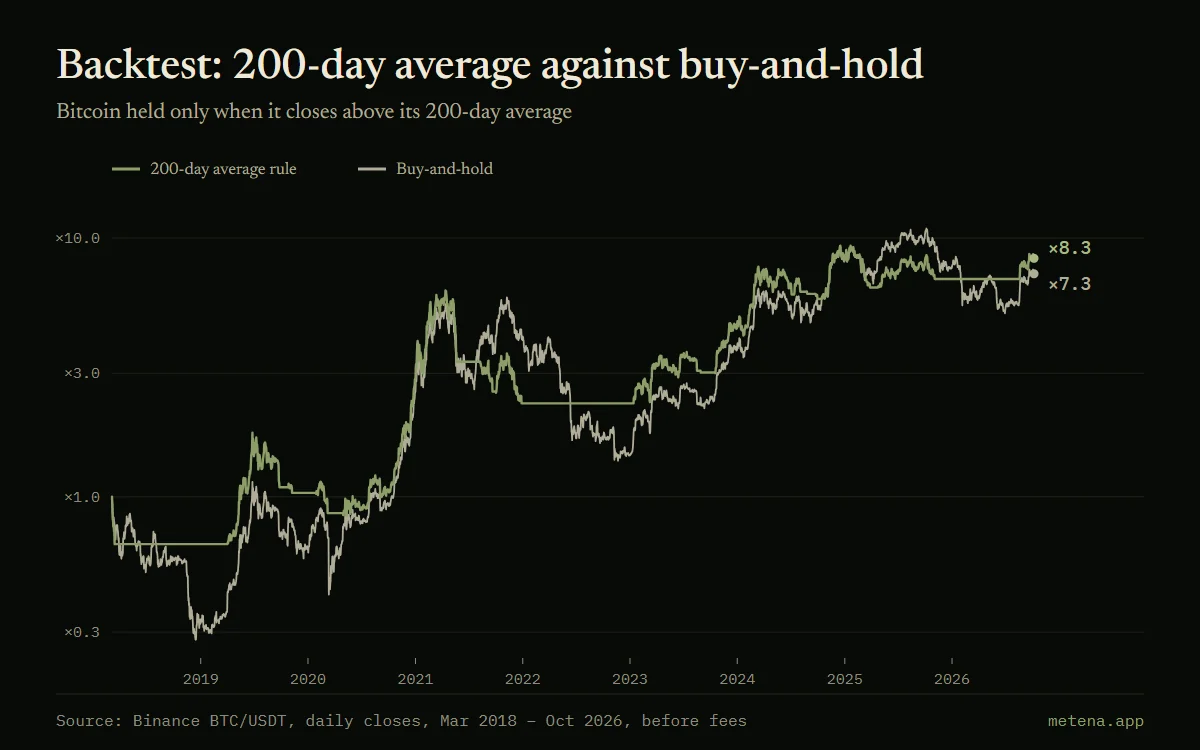
The rule is: hold bitcoin when it closed above its 200-day average the day before, otherwise stay in dollars. The decision uses the previous day’s close, so as not to rely on information you would not have had.
From 5 March 2018 to 7 October 2026, before fees, this rule multiplies capital by 8.3. Buy-and-hold multiplies it by 7.3. The rule was invested only 52% of the time.
Look at the losses before the return
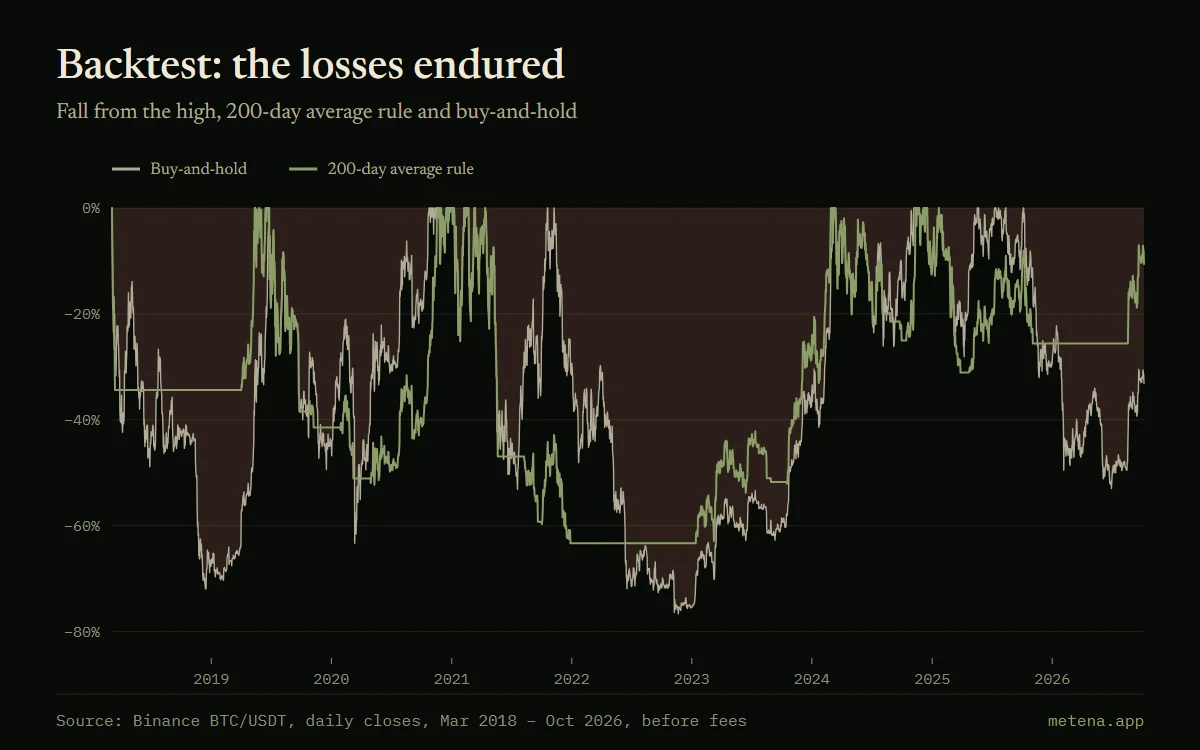
The final multiple hides the path. The rule’s maximum drawdown is −63%, against −77% for buy-and-hold: shallower, but far from comfortable. Over the period, the rule’s portfolio spent 698 days more than 50% below its high, against 739 days for buy-and-hold.
The useful question is therefore: would you have followed this rule for those 698 days? A backtest that wins at the end but that you would have abandoned halfway is worth nothing in practice. That is why maximum drawdown and the length of the lows matter as much as the return.
The overfitting trap
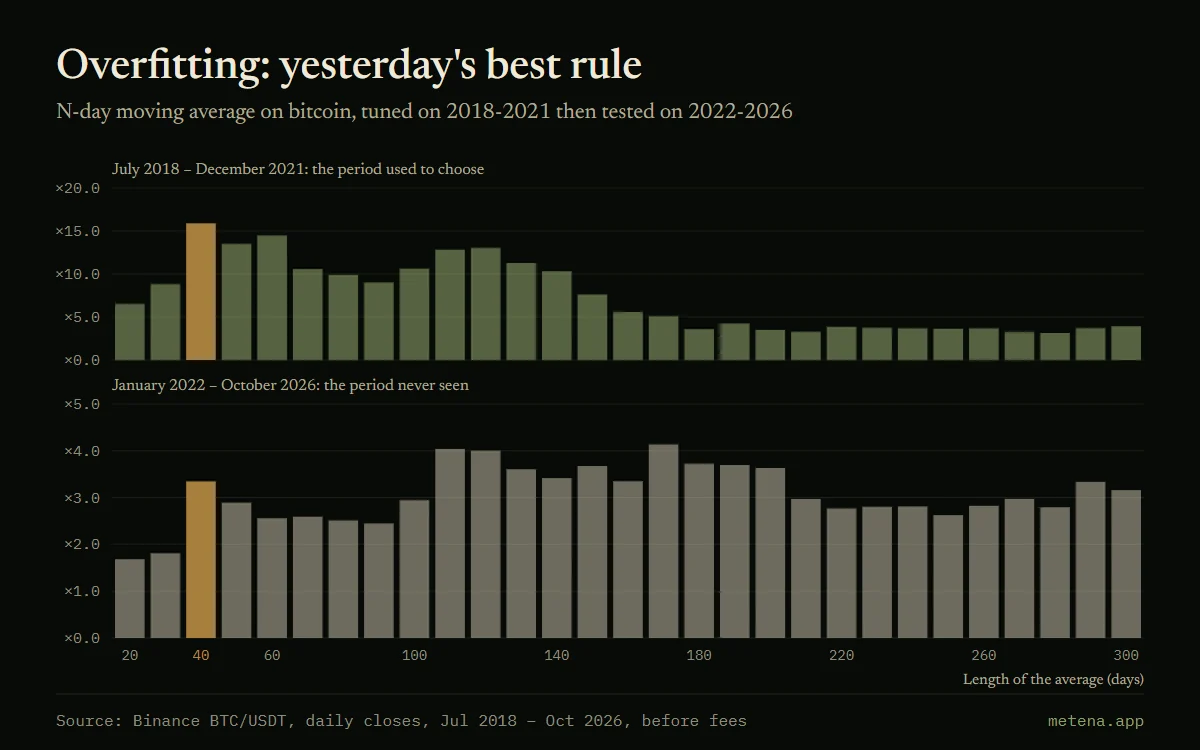
Why 200 days and not 150 or 40? If you test every length and keep the best, you get a superb result on the past, partly due to chance. That is overfitting: the rule has adapted to the noise of the history rather than to a lasting market behaviour.
The experiment is easy to reproduce. Test the rule with averages from 20 to 300 days over July 2018 to December 2021. The best is the 40-day average, which multiplies capital by 15.9 over that period, against 7.3 for buy-and-hold. Then apply each length as it is to the following period, January 2022 to October 2026, which was not used to choose it.
Out of sample, the 40-day average only multiplies capital by 3.3 and ranks 11th out of 29. The best length on the new period is the 170-day average (×4.1), which was only middling on the first. The 200-day average, chosen by convention rather than optimisation, gives ×3.5 and then ×3.6: less brilliant at first, more stable afterwards.
One past, many possible futures
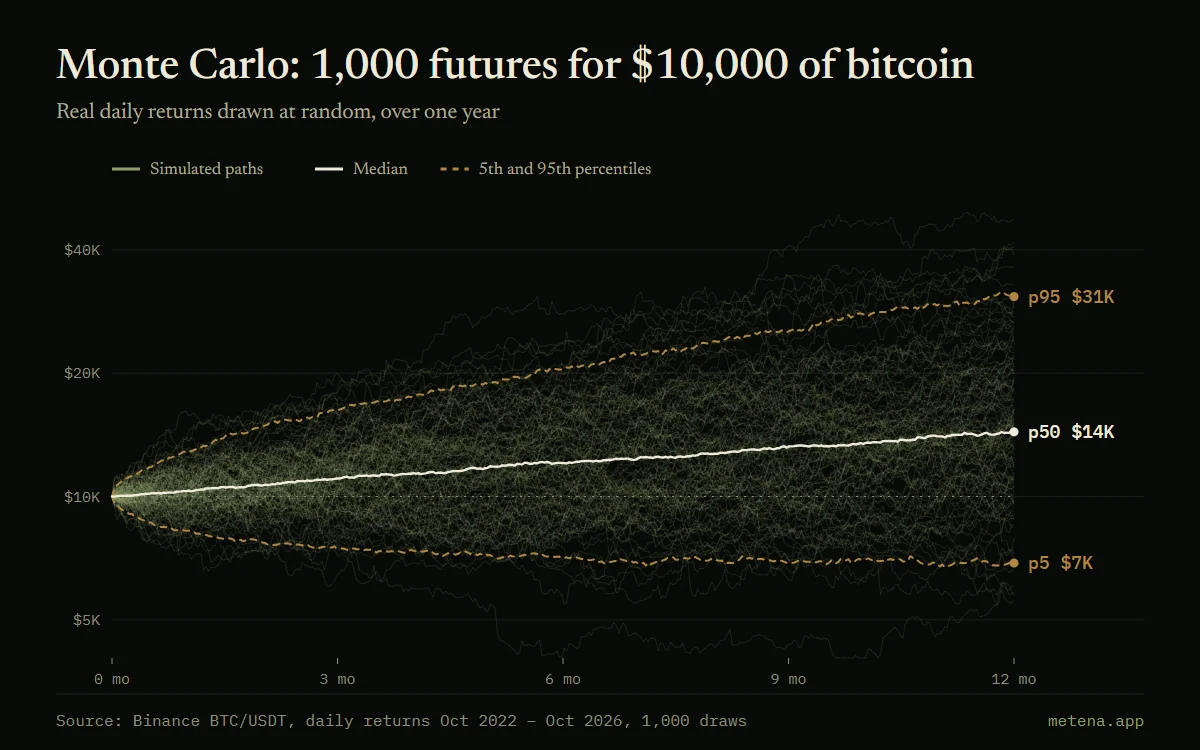
Even a rule that was not optimised has been tested on only one history. A Monte Carlo simulation builds thousands of others by drawing the observed daily moves at random, to see the range of outcomes.
Applied to $10,000 invested in bitcoin for a year, with returns from October 2022 to October 2026, it gives a median of $14,381, but a 5th percentile of $6,884 and a 95th of $30,752. A backtest result is one point in that distribution, not a promise.
What fees change
The figures in this guide are before fees. A rule that changes position often pays fees every time it switches, and the gap between the displayed price and the price actually obtained, known as slippage, comes on top. On the large exchanges, fees on a spot order range from about 0.1% to 0.6% depending on the plan.
The effect depends on the number of trades. A rule that makes ten round trips a year at 0.5% per order loses 10% a year before earning anything. A slow rule, such as the 200-day average, rarely changes position and is less sensitive to this. A fast rule can see its whole edge disappear.
Survivorship bias
A backtest covers assets that still exist. Testing a strategy on today’s ten largest cryptos means choosing, after the fact, the ones that survived. LUNA was among the top ten in April 2022 and was worth a fraction of a cent a month later.
To limit this bias, test the rule on the list of assets as it stood at the start of the period. Failing that, keep to assets with a long history, and read the result as an upper bound.
The checklist
Before trusting a backtest, check five points. Does the rule make its decisions with information available at that moment? Are fees and price slippage counted? Does the period cover at least one strong rise and one strong fall? Were the settings chosen on a different period from the one shown? Is the maximum drawdown bearable for you?
A backtest does not prove a strategy will work. It can, however, show that it would not have worked, or that it requires taking more than you would accept. That is already a lot.
In Metena
Metena’s backtest replays your strategy as written, then puts it through a Monte Carlo simulation and a validation on a period that was not used to tune it.
Notify me at launchGlossary terms
- Backtest
- Replaying a strategy on past data to measure what it would have delivered. Useful for testing rules, but the past does not predict the future.
- Maximum drawdown
- The largest fall, as a percentage, from a peak to the low that follows. It measures what you must be able to withstand without abandoning your strategy.
- Monte Carlo simulation
- A method that generates thousands of possible paths from your rules, to see the range of outcomes instead of a single scenario. Each path is a possible future, not a forecast.
- Percentile (p5, p95)
- The 5th percentile is the value below which 5% of simulated scenarios fall; the 95th is the value only 5% exceed. They bound the low and high scenarios.
- Moving average (SMA, EMA)
- The average price over a given period: it smooths out noise and brings out the trend. The EMA gives more weight to recent prices.
- Sharpe ratio
- Return relative to the volatility endured. The higher it is, the more the return was earned with moderate turbulence.


Related guides
- Building a crypto strategy from A to Z
- Thesis, allocation, position sizing, entry and exit rules, testing: the parts of a written crypto strategy, in the order in which they are decided.
- Bitcoin DCA: what seven years of data show
- Investing a fixed amount in bitcoin every week: real results since 2019, comparison with a lump sum, the worst time to start and the average cost.
- Writing your investment thesis and invalidation conditions
- How to write a crypto investment thesis, turn it into rules and set invalidation conditions, with the real examples of Terra-LUNA and FTX in 2022.
- Crypto risk management: position sizing, leverage and liquidation
- How much to put in each position, what leverage really changes and why diversifying across cryptocurrencies protects little: real bitcoin and ether examples.
- When to sell your crypto: writing your exit plan
- Take-profit levels, stop, invalidation condition, rebalancing: four reasons to sell that should be written before buying, with worked examples.



Put these ideas into practice.
Write your strategy in a few minutes: Metena analyses it when you ask and explains each term in context.
Notify me at launchEducational content. It is not investment advice. Crypto-assets carry a high risk that can go as far as the total loss of capital.